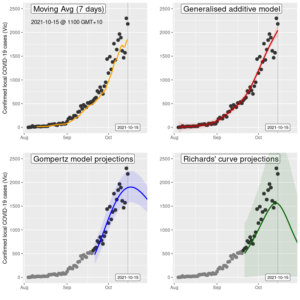
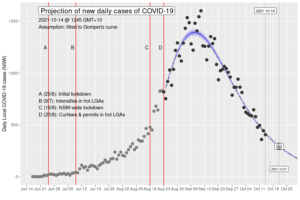
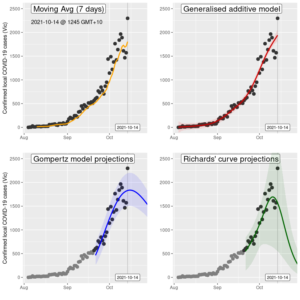
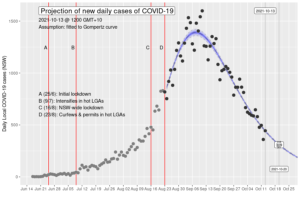
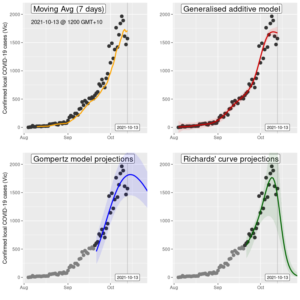
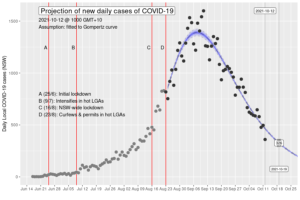
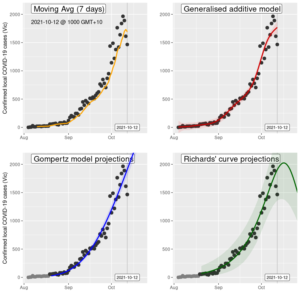
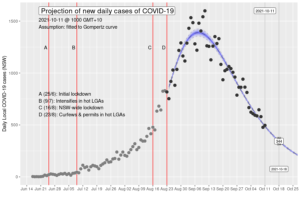
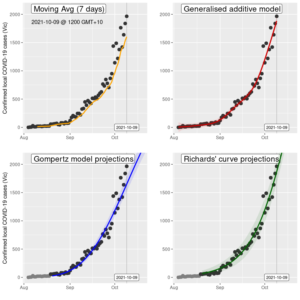
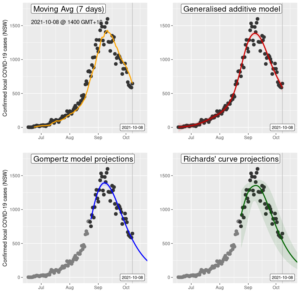
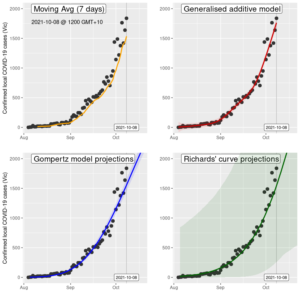
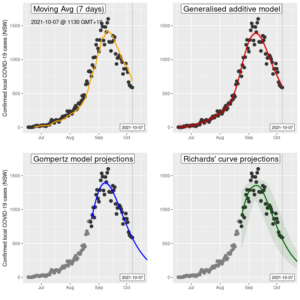
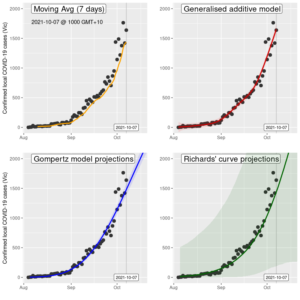
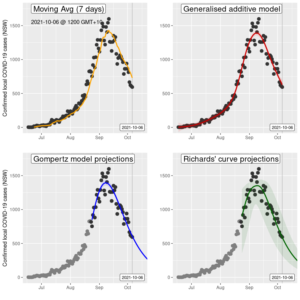
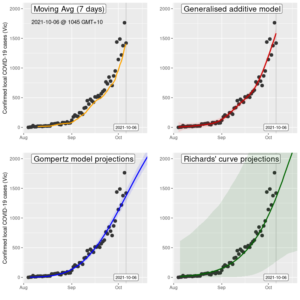
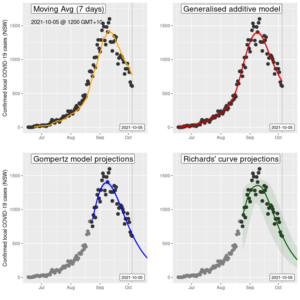
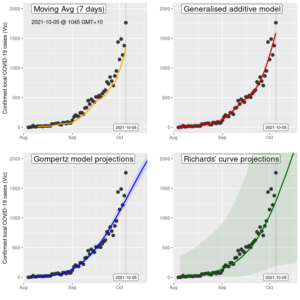
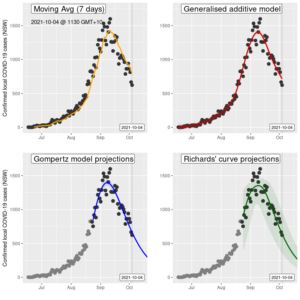
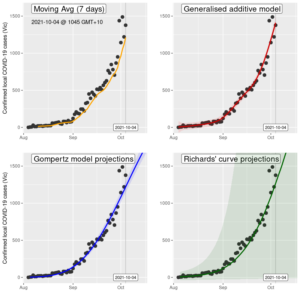
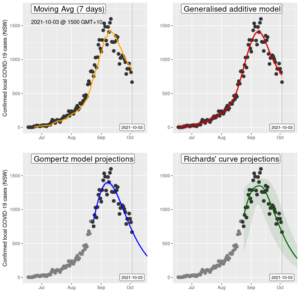
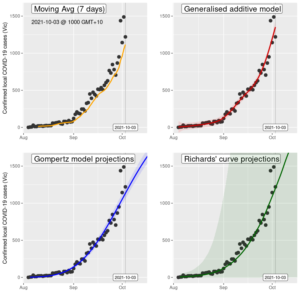
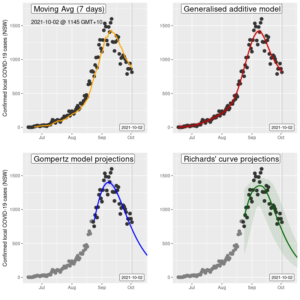
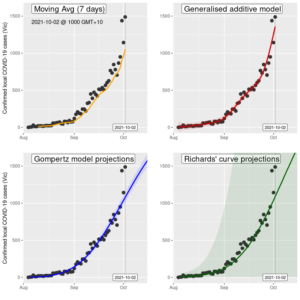
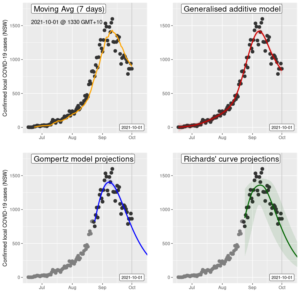
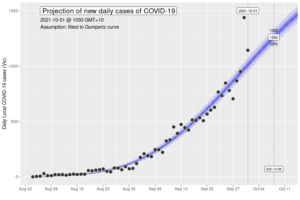
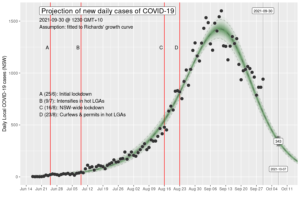
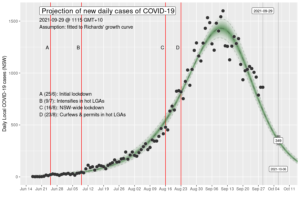
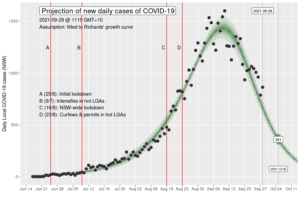
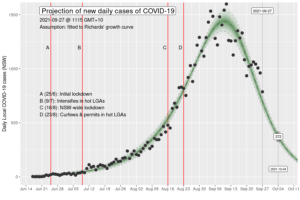
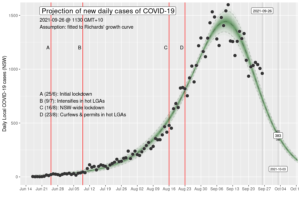
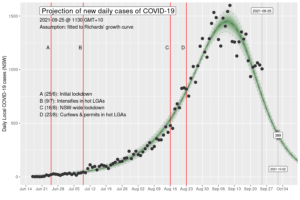
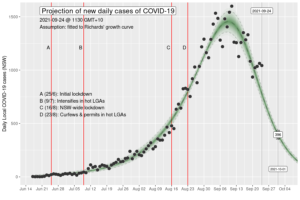
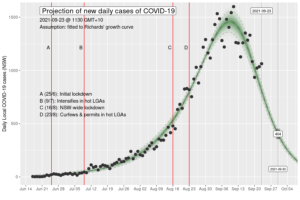
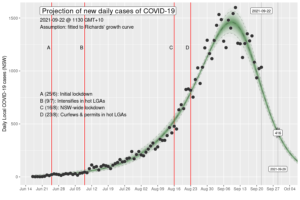
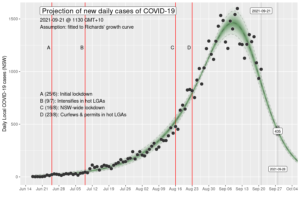
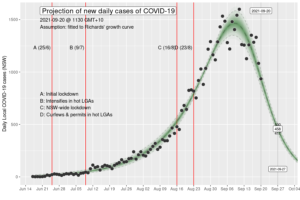
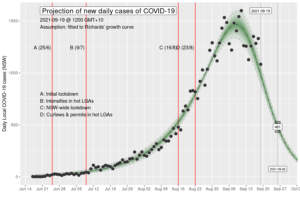
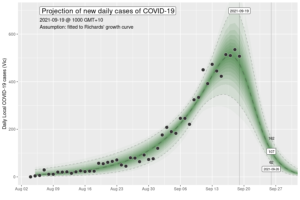
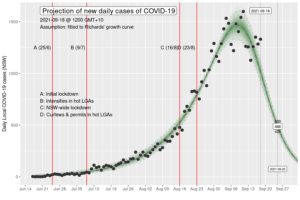
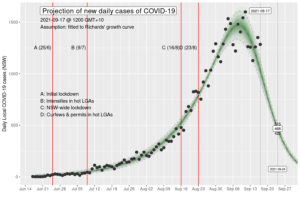
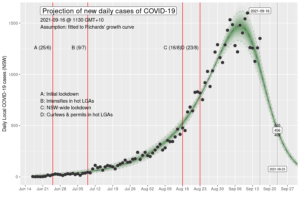
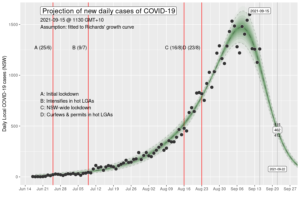
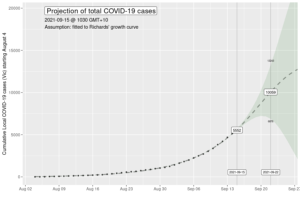
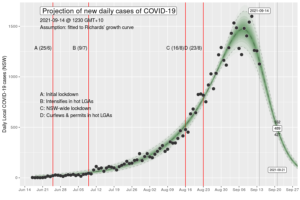
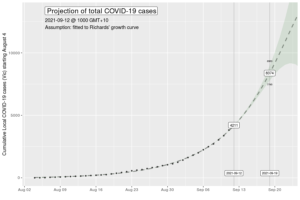
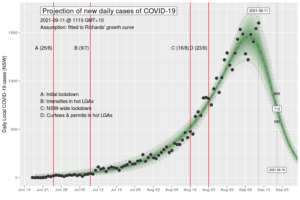
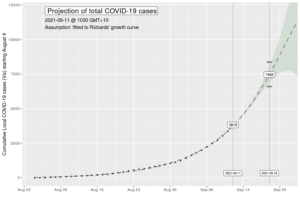
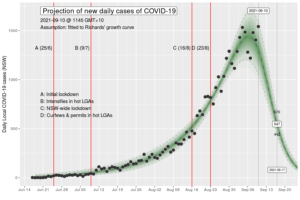
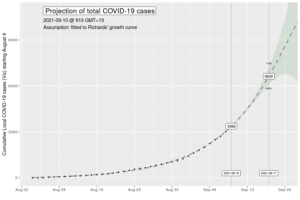
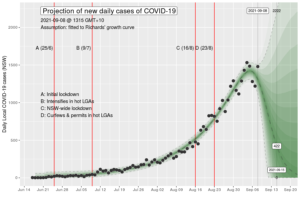
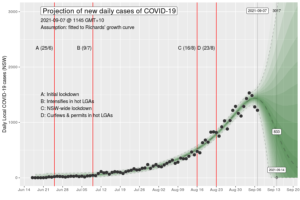
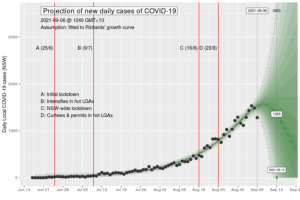
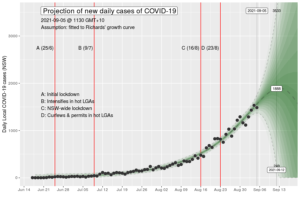
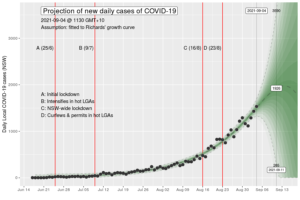
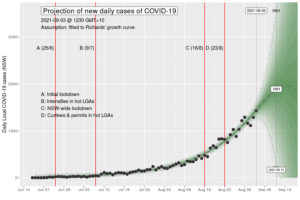
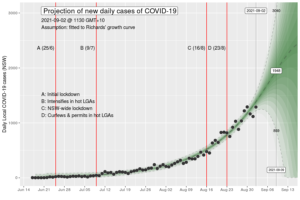
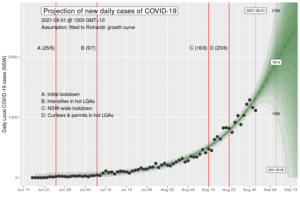
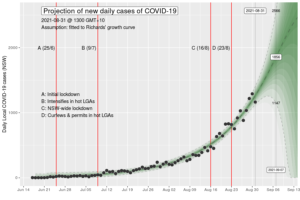
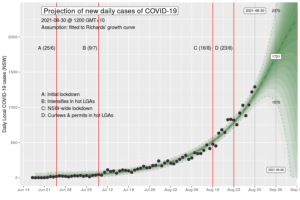
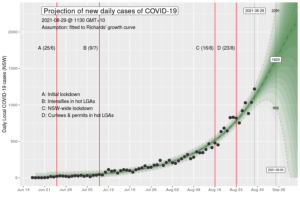
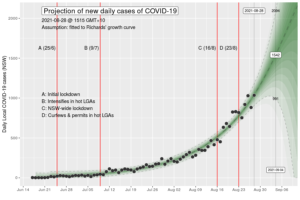
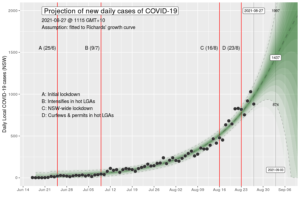
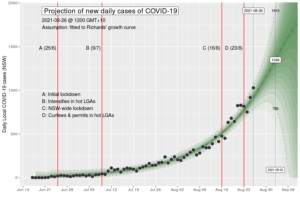
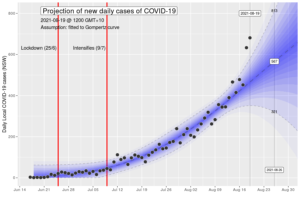
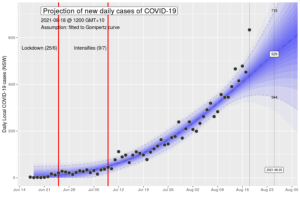
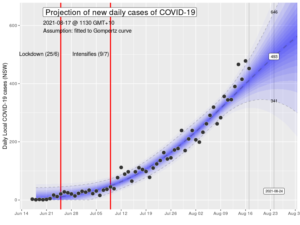
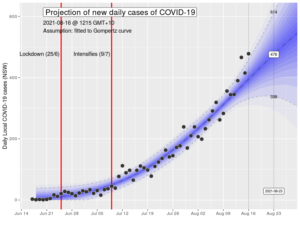
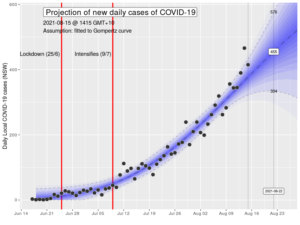
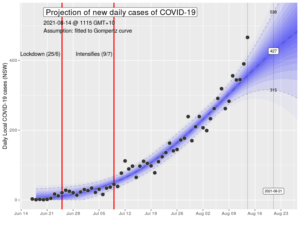
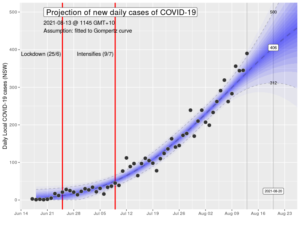
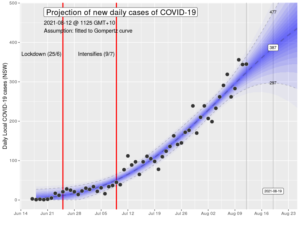
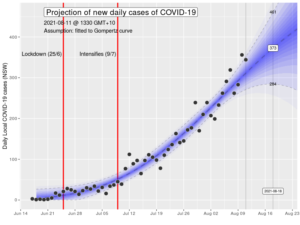
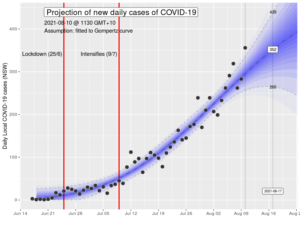
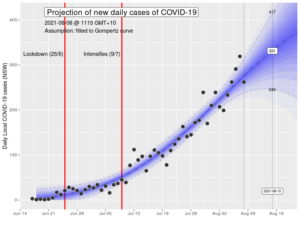
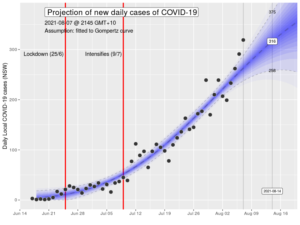
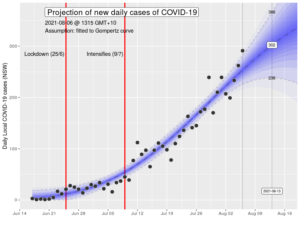
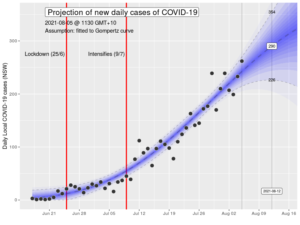
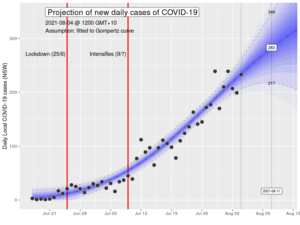
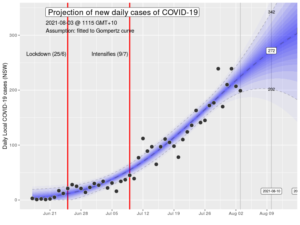
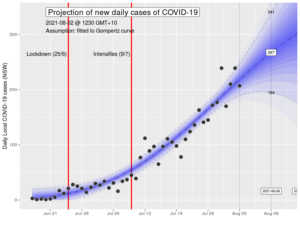
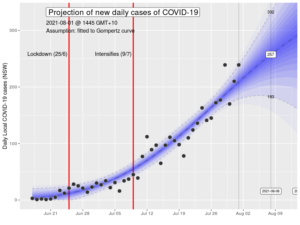
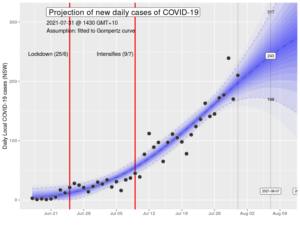
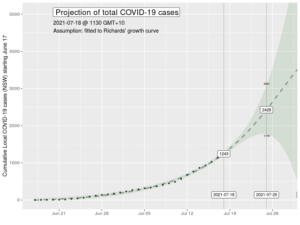
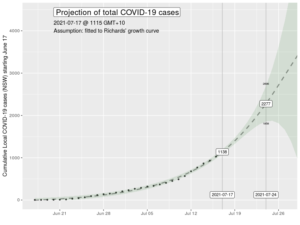
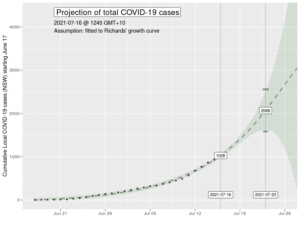
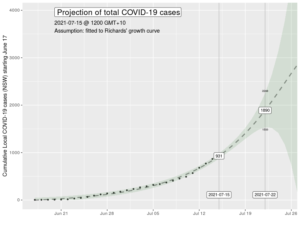
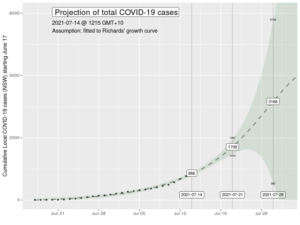
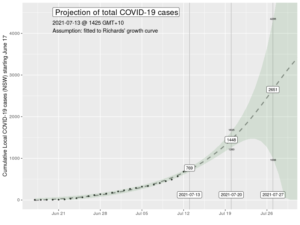
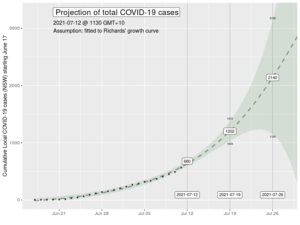
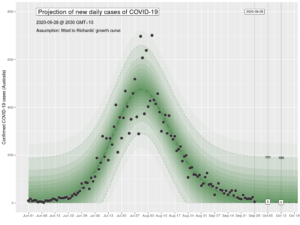
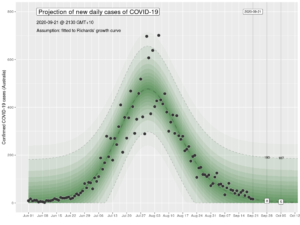
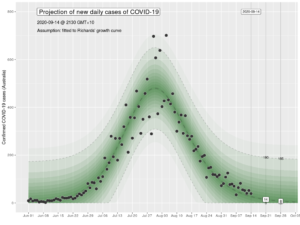
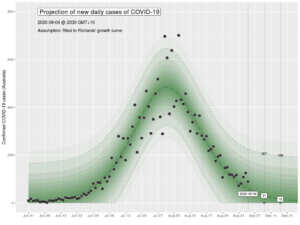
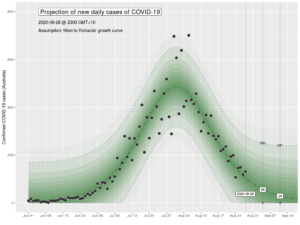
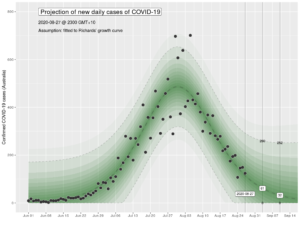
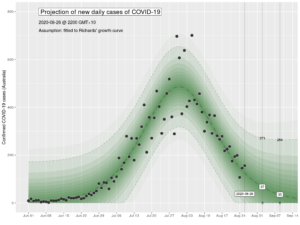
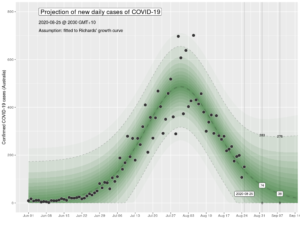
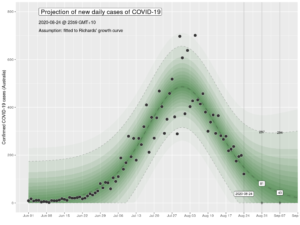
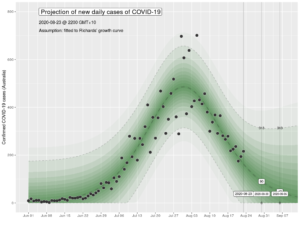
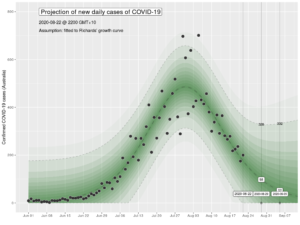
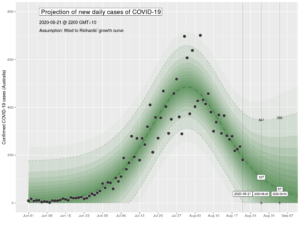
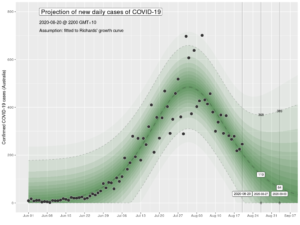
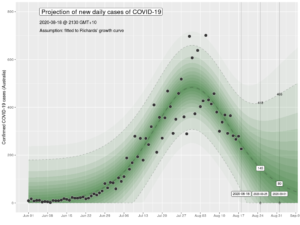
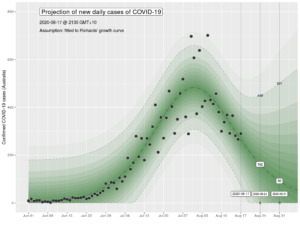
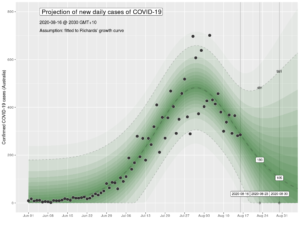
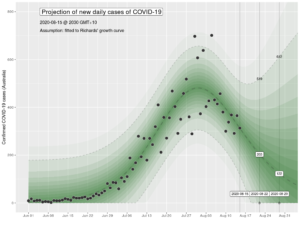
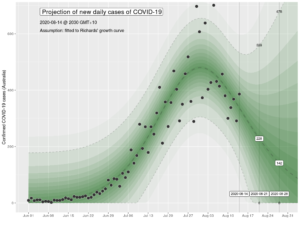
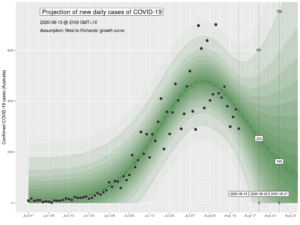
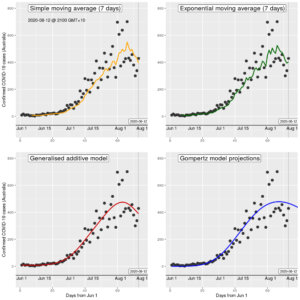
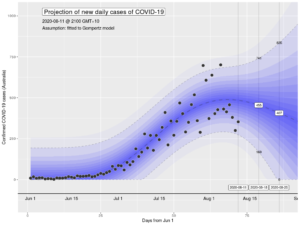
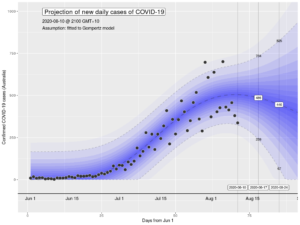
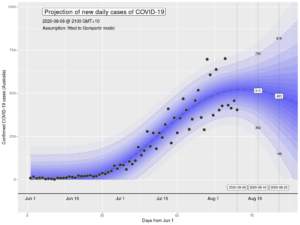
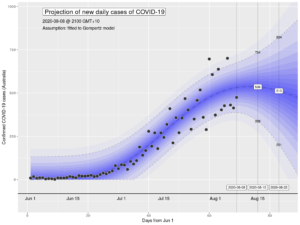
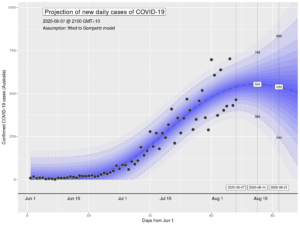
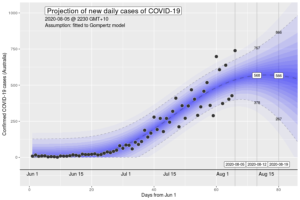
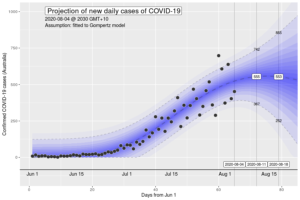
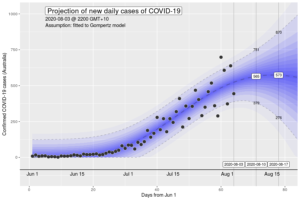
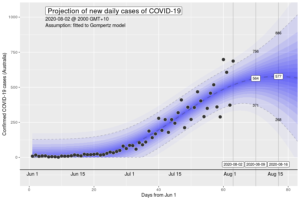
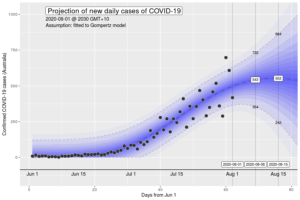
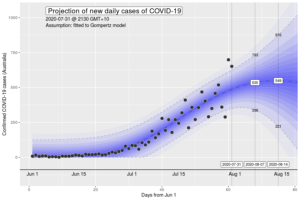
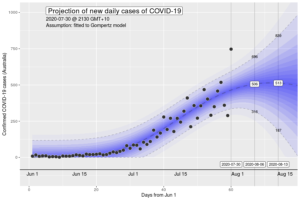
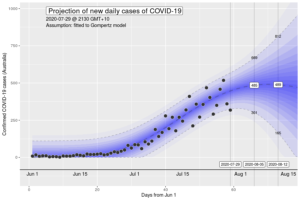
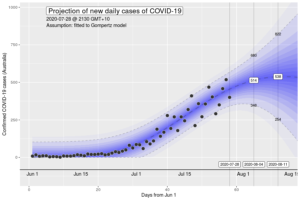
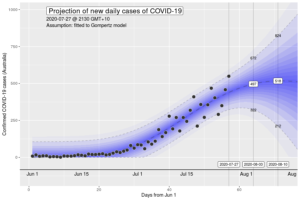
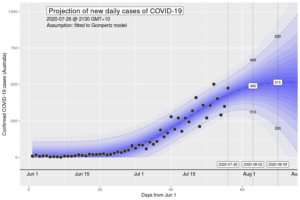
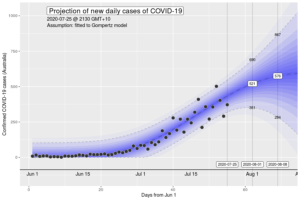
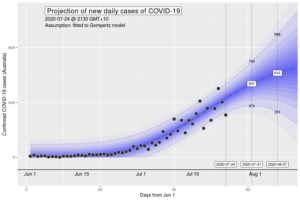
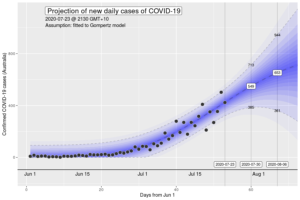
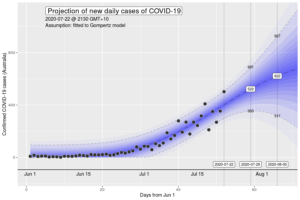
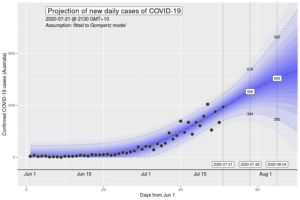
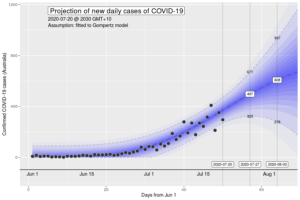
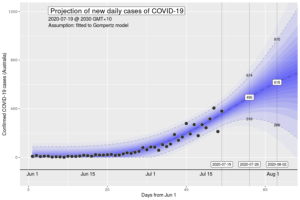
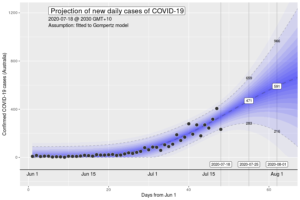
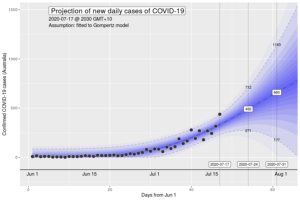
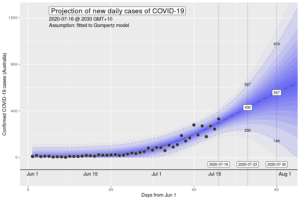
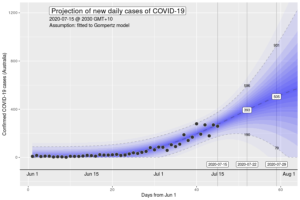
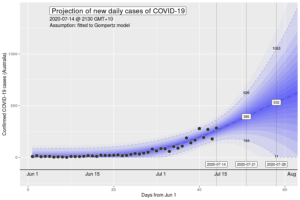
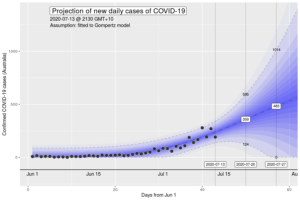
These are daily projections of new daily cases of COVID-19, in the July 2020 outbreak starting in Melbourne, and the June 2021 outbreak starting in Sydney.
COVID-19 projections
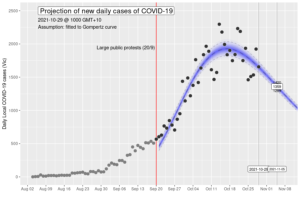
Victoria COVID-19 projections – 29 October 2021 (Final)
What’s new? This is the final update in the 2021 Victoria outbreak (resulting in the sixth Melbourne lockdown) series. Victoria exited its lockdown one week ago. Moving forward, the assumption used in the model (projections into the future based algorithmically on the same transmission dynamics in the past) cannot be taken to be theoretically valid. …
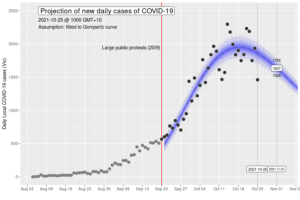
Victoria COVID-19 projections – 25 October 2021
What’s new? Today’s announcement was 1461 new local cases remains very consistent with the Gompertz model. Both models indicate that we have crossed the peak in this outbreak. The Richards’ growth curve model still has significant uncertainty though this has been reducing gradually over days as the model “catches up”. I expect that the models will …
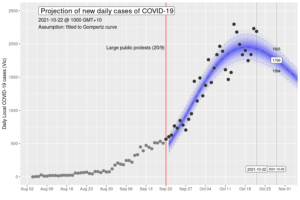
Victoria COVID-19 projections – 22 October 2021
What’s new? Today’s announcement was 2189 new local cases remains very consistent with the Gompertz model. Both models indicate that we are approaching/have approached the peak in this outbreak in Melbourne. The Richards’ growth curve model still has significant uncertainty though this has been reducing gradually over days as the model “catches up”. I expect that …
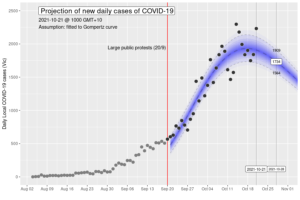
Victoria COVID-19 projections – 21 October 2021
What’s new? Today’s announcement was 2232 new local cases remains very consistent with the Gompertz model. Both models indicate that we are approaching the peak in this outbreak in Melbourne. The Richards’ growth curve model has significant uncertainty. I expect that the models will improve as more data is included. The Gompertz model estimates around 12,000-13,500 …
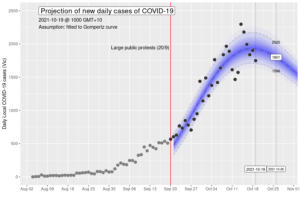
Victoria COVID-19 projections – 19 October 2021
What’s new? Today’s announcement was 1749 new local cases is very consistent with the new Gompertz model. Both models indicate that we are approaching the peak in this outbreak in Melbourne. The Richards’ growth curve model has significant uncertainty. I expect that the models will improve as more data is included. The Gompertz model estimates around …
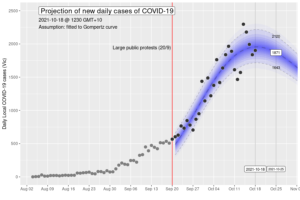
Victoria COVID-19 projections – 18 October 2021
What’s new? Today’s announcement was 1903 new local cases is consistent with the new Gompertz model. Both models indicate that we are approaching the peak in this outbreak in Melbourne. With the more limited data, I’m not very confident with the projection estimates, other than the general shape of their trajectories. The Richards’ growth curve model …
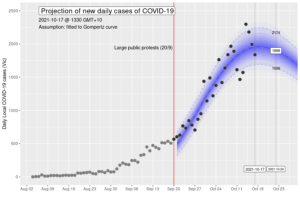
Victoria COVID-19 projections – 17 October 2021
What’s new? Today’s announcement was 1838 new local cases is consistent with the new Gompertz model. Both models indicate that we are approaching the peak in this outbreak in Melbourne. With the more limited data, I’m not very confident with the projection estimates, other than the general shape of their trajectories. The Richards’ growth curve model …
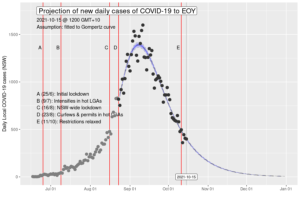
NSW COVID-19 projections – 15 October 2021 (Final)
What’s new? This will be the final set of projections for the Sydney/NSW COVID-19 outbreak that started in mid-June 2021, initially with the first cases identified in Bondi. Today is day 5 into the reduction of public health restrictions to contain the outbreak, and it is likely that moving forward, the model will no longer …
Victoria COVID-19 projections – 15 October 2021
What’s new? Today’s announcement was 2179 new local cases remains quite consistent with the new Gompertz model. My interpretation is the seeming spike in cases over the past two days needs to be interpreted in the light that the lower than expected case numbers from the past couple of days, which were likely artifactually low. …
Sydney COVID-19 projections – 14 October 2021
What’s new? Today’s announcement was 406 new local cases in NSW is another very welcome drop, and highly consistent with the new models. The Gompertz model has been performing especially well with 7-day projections with < 1% error, and the 14-day projections < 2% error. The Gompertz model is (slightly, but consistently) outperforming the Richards’ …
Victoria COVID-19 projections – 14 October 2021
What’s new? Today’s announcement was 2287 new local cases, the highest on record. It is, however, quite consistent with the models, especially the new Gompertz model. My interpretation is that this seemingly spike in cases needs to be interpreted in the light that the lower than expected case numbers from the past couple of days …
Sydney COVID-19 projections – 13 October 2021
What’s new? Today’s announcement was 444 new local cases in NSW is another very welcome drop, and highly consistent with the new models. The Gompertz model has been performing especially well with 7-day projections with < 1% error, and the 14-day projections < 2% error. The Gompertz model is (slightly, but consistently) outperforming the Richards’ …
Victoria COVID-19 projections – 13 October 2021
What’s new? Firstly, I have made a substantial change in the model again. A few days ago, a made a change in the model to fit data from later in the outbreak, from mid-August 2021, via non-linear regression to the Gompertz and Richards’ growth curves. The logic was the the transmission dynamics and context of …
Sydney COVID-19 projections – 12 October 2021
What’s new? Today’s announcement was 360 new local cases in NSW is another very welcome drop, and consistent with the new models. The Gompertz model has been performing especially well with 7-day projections with < 1% error, and the 14-day projections < 2% error. The Gompertz model is (slightly, but consistently) outperforming the Richards’ growth …
Victoria COVID-19 projections – 12 October 2021
What’s new? Today’s announcement was 1466 new local cases is rather lower than projected, which is very welcome. This might indicate that we are approaching the peak in this outbreak in Melbourne and I am quietly hopeful. The Gompertz and Richards’ growth curve models give different and incompatible trajectories. The Gompertz model suggests ongoing growth. …
Sydney COVID-19 projections – 11 October 2021
What’s new? Today’s announcement was 496 new local cases in NSW is highly consistent with the new models. The Gompertz model has been performing especially well with 7-day projections with < 1% error, and the 14-day projections < 2% error. The Gompertz model is (slightly, but consistently) outperforming the Richards’ growth curve model. The Gompertz …
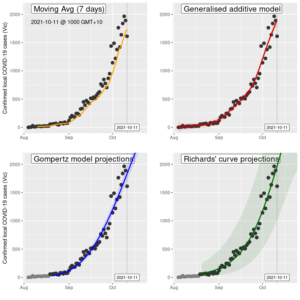
Victoria COVID-19 projections – 11 October 2021
What’s new? Today’s announcement was 1612 new local cases and is mostly consistent with the trend of ongoing growth in cases. The number of cases are less than projected, but this has often been the case for case counts on Mondays, and probably represents a weekend effect. On 9 October 2021, I revised the models …
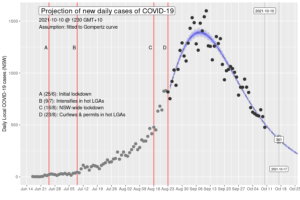
Sydney COVID-19 projections – 10 October 2021
What’s new? Today’s announcement was 477 new local cases in NSW is highly consistent with the new models. The models have been performing well with 7-day projections within 2% error, and the 14-day projections within 3% error. The Gompertz model is (slightly, but consistently) outperforming the Richards’ growth curve model. The Gompertz model estimates 2700-3100 …
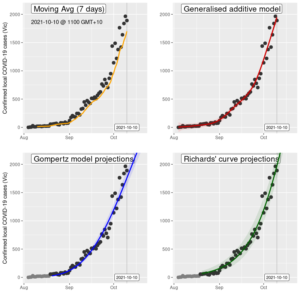
Victoria COVID-19 projections – 10 October 2021
What’s new? Today’s announcement was 1890 new local cases and is very consistent with the trend of ongoing growth in cases. Yesterday (9 October 2021), I revised the models used in the Victorian COVID-19 outbreak (August 2021) resulting in the sixth Victorian lockdown. Those who have followed this modelling series would have observed that the …
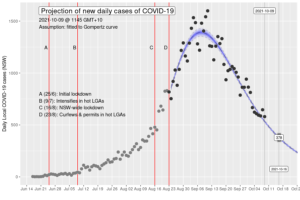
Sydney COVID-19 projections – 9 October 2021
What’s new? Today’s announcement was 580 new local cases in NSW is highly consistent with the new models. The models have been performing well with 7-day projections within 0-2% error, with the Gompertz model outperforming the Richards’ growth curve model. The Gompertz model estimates 2800-3200. Context and timeline of the Sydney 2021 outbreak I …
Victoria COVID-19 projections – 9 October 2021
What’s new? Today’s announcement was 1965 new local cases is the highest yet, and unfortunately remains consistent with the trend of ongoing growth in cases. Today, I revised the models used in the Victorian COVID-19 outbreak (August 2021) resulting in the sixth Victorian lockdown. Those who have followed this modelling series would have observed that …
Sydney COVID-19 projections – 8 October 2021
What’s new? Today’s announcement was 646 new local cases in NSW is highly consistent with the new models. The new models have been performing well with 7-day projections within 0-2% error, with the Gompertz model slightly outperforming the Richards’ growth curve model. The new Richards’ growth curve model estimates that we will see around 2700-3200 …
Victoria COVID-19 projections – 8 October 2021
What’s new? Today’s announcement was 1838 new local cases, and remains consistent with the trend of ongoing growth in cases. The Gompertz model projects a trajectory of case growth and it may be an underestimate in the short term. The model estimates around 11,500-12,500 new cases in the coming week. However, if the transmission dynamics …
Sydney COVID-19 projections – 7 October 2021
What’s new? Today’s announcement was 587 new local cases in NSW is highly consistent with the new models. The new models have been performing well with 7-day projections within 0-2% error, with the Gompertz model slightly outperforming the Richards’ growth curve model. The new Richards’ growth curve model estimates that we will see around 3000-3400 …
Victoria COVID-19 projections – 7 October 2021
What’s new? Today’s announcement was 1638 new local cases, consistent with the trend of ongoing growth in cases. The Gompertz model projects a trajectory of case growth and it may be an underestimate in the short term. The model estimates around 11,000-12,000 new cases in the coming week. However, if the transmission dynamics have significantly …
Sydney COVID-19 projections – 6 October 2021
What’s new? Today’s announcement was 594 new local cases in NSW is highly consistent with the new models. The new models have been performing well with 7-day and 14-day projections within 1-2% error, with the Gompertz model slightly outperforming the Richards’ growth curve model. The new Richards’ growth curve model estimates that we will see …
Victoria COVID-19 projections – 6 October 2021
What’s new? Today’s announcement was 1420 new local cases, consistent with the trend of ongoing growth in cases. The Gompertz model projects a trajectory of case growth and it may be an underestimate in the short term. The model estimates around 10,000-11,000 new cases in the coming week. However, if the transmission dynamics have significantly …
Sydney COVID-19 projections – 5 October 2021
What’s new? Today’s announcement was 608 new local cases in NSW is highly consistent with the new models. The new models have been performing well with 7-day and 14-day projections within 1-2% error, with the Gompertz model slightly outperforming the Richards’ growth curve model. The new Richards’ growth curve model estimates that we will see …
Victoria COVID-19 projections – 5 October 2021
What’s new? Today’s announcement was 1763 new local cases is the highest of the outbreak. The Gompertz model projects an ongoing trajectory of case growth and is likely an underestimate. The model estimates around 9,500-10,500 new cases in the coming week. However, if the transmission dynamics have significantly changed over the past week, then these …
Sydney COVID-19 projections – 4 October 2021
What’s new? Today’s announcement was 623 new local cases in NSW is highly consistent with the new models. The new models have been performing well with 7-day and 14-day projections within 1-2% error, with the Gompertz model slightly outperforming the Richards’ growth curve model. The new Richards’ growth curve model estimates that we will see …
Victoria COVID-19 projections – 4 October 2021
What’s new? Today’s announcement was 1377 new local cases seems to confirm that the escalation in cases from the last few days is not a statistical fluke. The worrying possibility is that this represents a major transmission event with a change in the overall outbreak dynamics. The Gompertz model projects an ongoing trajectory of case …
Sydney COVID-19 projections – 3 October 2021
What’s new? Today’s announcement was 667 new local cases in NSW is highly consistent with the new models. The new models have been performing well with 7-day and 14-day projections within 1-2% error. The new Richards’ growth curve model estimates that we will see around 3300-3900 cases over the next 7 days. The new Gompertz …
Victoria COVID-19 projections – 3 October 2021
What’s new? Today’s announcement was 1220 new local cases seems to confirm that the escalation in cases from the last few days is not a statistical fluke. The worrying possibility is that this represents a major transmission event with a change in the overall outbreak dynamics. The Gompertz model projects an ongoing trajectory of case …
Sydney COVID-19 projections – 2 October 2021
What’s new? Today’s announcement was 813 new local cases in NSW is consistent with the new models. The new models have been performing well with 7-day projections within 1-2% error. The new Richards’ growth curve model estimates that we will see around 3400-4000 cases over the next 7 days. The new Gompertz model estimates 3600-4100. …
Victoria COVID-19 projections – 2 October 2021
What’s new? Today’s announcement was 1488 new local cases seems to confirm that the spike in cases from the last couple of days is not a blip or a statistical fluke. The worrying possibility is that this represents a major transmission event with a change in the overall outbreak dynamics. The Gompertz model projects an …
Sydney COVID-19 projections – 1 October 2021
What’s new? Today’s announcement was 864 new local cases in NSW is consistent with the new models. However, firstly, I’ve substantially changed the models. Prior to today, the models were constructed using the cumulative case data starting from 17 June 2021, which was the day of the first cases of the outbreak. The underlying assumption …
Victoria COVID-19 projections – 1 October 2021
What’s new? Today’s announcement was 1143 new local cases, which is higher than expected. This came after yesterday’s shockingly high number of new count of 1438. The worrying possibility is that this represents a major transmission event with a change in the overall outbreak dynamics. Mainstream media are pointing to the possibility that this was …
Sydney COVID-19 projections – 30 September 2021
What’s new? Today’s announcement was 941 new local cases in NSW is consistent with the the model, though the fall in case numbers is slower than projected. The flexible nature of the Richards’ growth curve model at this point means that there is some significant uncertainty regarding the trajectory of the growth in the near …
Victoria COVID-19 projections – 30 September 2021
What’s new? Today’s announcement was 1438 new local cases in Victoria was a shockingly high value, that is inconsistent with the existing model. This may simply an outlier, but the worrying possibility is that this represents a real major transmission event. Mainstream media are pointing to the possibility that this was the result of the …
Sydney COVID-19 projections – 29 September 2021
What’s new? Today’s announcement was 863 new local cases in NSW is consistent with the the model, though the fall in case numbers is slower than projected. The flexible nature of the Richards’ growth curve model at this point means that there is some significant uncertainty regarding the trajectory of the growth in the near …
Victoria COVID-19 projections – 29 September 2021
What’s new? Today’s announcement was 950 new local cases in Victoria was a jump, and fits very well with the Gompertz model and projections. The Richards’ model has suggested the approaching of a peak, but this has proven incorrect over the past week. Although a peak must occur at some time in the future, when …
Sydney COVID-19 projections – 28 September 2021
What’s new? Today’s announcement was 863 new local cases in NSW is consistent with the the model. This is the lowest number of new daily cases since we’ve crossed the peak, which is very welcome. The flexible nature of the Richards’ growth curve model at this point means that there is some significant uncertainty regarding …
Victoria COVID-19 projections – 28 September 2021
What’s new? Today’s announcement was 867 new local cases in Victoria fits very well with the Gompertz model and is less compatible with the Richards’ growth curve model. The Richards’ model suggests the approaching of a peak, but this has proven incorrect over the past week. Although a peak must occur at some time in …
Sydney COVID-19 projections – 27 September 2021
What’s new? Today’s announcement was 787 new local cases in NSW is consistent with the the model. This is the lowest number of new daily cases since we’ve crossed the peak, which is very welcome. The flexible nature of the Richards’ growth curve model at this point means that there is some significant uncertainty regarding …
Victoria COVID-19 projections – 27 September 2021
What’s new? Today’s announcement was 705 new local cases in Victoria fits very well with the Gompertz model and is less compatible with the Richards’ growth curve model. The Richards’ model suggests the approaching of a peak, but this has proven incorrect over the past week. Although a peak must occur at some time in …
Sydney COVID-19 projections – 26 September 2021
What’s new? Today’s announcement was 961 new local cases in NSW is mostly consistent with the the model, though the fall in the number of new cases is slower than projected. The flexible nature of the Richards’ growth curve model at this point means that there is some significant uncertainty regarding the trajectory of the …
Victoria COVID-19 projections – 26 September 2021
What’s new? Today’s announcement was 779 new local cases in Victoria fits very well with the Gompertz model and is incompatible with the Richards’ growth curve model. In essence, it is unlikely, unfortunately, that the Richards’ growth curve model which describes a “peaking” of new cases is correct. The Gompertz model projects an ongoing trajectory …
Sydney COVID-19 projections – 25 September 2021
What’s new? Today’s announcement was 1007 new local cases in NSW is mostly consistent with the the model, though the fall in the number of new cases is slower than projected. The flexible nature of the Richards’ growth curve model at this point means that there is some significant uncertainty regarding the trajectory of the …
Victoria COVID-19 projections – 25 September 2021
What’s new? Today’s announcement was 847 new local cases in Victoria fits very well with the Gompertz model and is incompatible with the Richards’ growth curve model. In essence, it is unlikely, unfortunately, that the Richards’ growth curve model which describes a “peaking” of new cases is correct. The Gompertz model projects an ongoing trajectory …
Sydney COVID-19 projections – 24 September 2021
What’s new? Today’s announcement was 1043 new local cases in NSW is mostly consistent with the the model, though the fall in the number of new cases seem to be slower than expected. The flexible nature of the Richards’ growth curve model at this point means that there is some significant uncertainty regarding the trajectory …
Victoria COVID-19 projections – 24 September 2021
What’s new? Today’s announcement was 733 new local cases in Victoria fits very well with the Gompertz model and is incompatible with the Richards’ growth curve model. In essence, it is unlikely, unfortunately, that the Richards’ growth curve model which describes a “peaking” of new cases is correct. The Gompertz model projects an ongoing trajectory …
Sydney COVID-19 projections – 23 September 2021
What’s new? Today’s announcement was 1063 new local cases in NSW is consistent with the the model. The flexible nature of the Richards’ growth curve model at this point means that there is some significant uncertainty regarding the trajectory of the growth in the near future. Any estimates, even in the immediate days needs to …
Victoria COVID-19 projections – 23 September 2021
What’s new? Today’s announcement was 766 new local cases in Victoria is fits very well with the Gompertz model and is incompatible with the Richards’ growth curve model. In essence, it is unlikely that the Richards’ growth curve model which describes a “peaking” of new cases is correct. The Gompertz model projects an ongoing trajectory …
Sydney COVID-19 projections – 22 September 2021
What’s new? Today’s announcement was 1035 new local cases in NSW is consistent with the the model. The flexible nature of the Richards’ growth curve model at this point means that there is some significant uncertainty regarding the trajectory of the growth in the near future. Any estimates, even in the immediate days needs to …
Victoria COVID-19 projections – 22 September 2021
What’s new? Today’s announcement was 628 new local cases in Victoria is compatible with both models, though again, a better fit with the Gompertz model than the Richards’ growth curve model for the second day in a row. The two models still have relatively good fit with the data, but provide different and incompatible projections …
Sydney COVID-19 projections – 21 September 2021
What’s new? Today’s announcement was 1022 new local cases in NSW is consistent with the the model. The flexible nature of the Richards’ growth curve model at this point means that there is some significant uncertainty regarding the trajectory of the growth in the near future. Any estimates, even in the immediate days needs to …
Victoria COVID-19 projections – 21 September 2021
What’s new? Today’s announcement was 603 new local cases in Victoria is compatible with both models, though a better fit with the Gompertz model than the Richards’ growth curve model. The two models still have relatively good fit with the data, but provide different and incompatible projections for the next week. The Gompertz model projects …
Sydney COVID-19 projections – 20 September 2021
What’s new? Today’s announcement was 935 new local cases in NSW is highly consistent with the observation that we have crossed the peak number of new cases, and consistent with the expectation that the model has been overly optimistic with the “descending limb” in the fall in cases. It is the first time for weeks …
Victoria COVID-19 projections – 20 September 2021
What’s new? Today’s announcement was 567 new local cases in Victoria is compatible with both models. The two models still have relatively good fit with the data, but provide different and incompatible projections for the next week. The Gompertz model projects an ongoing trajectory of case growth. The Richards’ growth curve model projections that the …
Sydney COVID-19 projections – 19 September 2021
What’s new? Today’s announcement was 1083 new local cases in NSW is consistent with the observation that we have crossed the peak number of new cases, and consistent with the expectation that the model has been overly optimistic with the “descending limb” in the fall in cases. The flexible nature of the Richards’ growth curve …
Victoria COVID-19 projections – 19 September 2021
What’s new? Today’s announcement was 507 new local cases in Victoria is very compatible with the Richards’ growth curve models, and less compatible with the Gompertz model. The two models still have relatively good fit with the data, but provide different and incompatible projections for the next week. The Gompertz model projects an ongoing trajectory …
Sydney COVID-19 projections – 18 September 2021
What’s new? Today’s announcement was 1331 new local cases in NSW is consistent with the observation that we have crossed the peak number of new cases, and consistent with the expectation that the model has been overly optimistic with the “descending limb” in the fall in cases. The flexible nature of the Richards’ growth curve …
Victoria COVID-19 projections – 18 September 2021
What’s new? Today’s announcement was 535 new local cases in Victoria is mostly compatible with both the Gompertz and Richards’ growth curve models, though it is still early days. Interestingly, the fit with both models is “okay” but they provide different and incompatible projections for the next week. It is not clear which model is/will …
Sydney COVID-19 projections – 17 September 2021
What’s new? Today’s announcement was 1284 new local cases in NSW is consistent with the observation that we have crossed the peak number of new cases, and consistent with the expectation that the model has been overly optimistic with the “descending limb” in the fall in cases. The flexible nature of the Richards’ growth curve …
Victoria COVID-19 projections – 17 September 2021
What’s new? Today’s announcement was 510 new local cases in Victoria is mostly compatible with both the Gompertz and Richards’ growth curve models, though it is still early days. Interestingly, the fit with both models is “okay” but they provide different and incompatible projections for the next week. It is not clear which model is/will …
Sydney COVID-19 projections – 16 September 2021
What’s new? Today’s announcement was 1351 new local cases in NSW is still consistent with the observation that we have crossed the peak number of new cases. A peak in September was suggested by the Richards’ growth model for over three weeks, though there has been uncertain. At this point, it is implausible that we …
Victoria COVID-19 projections – 16 September 2021
What’s new? Today’s announcement was 514 new local cases in Victoria is mostly compatible with both the Gompertz and Richards’ growth curve models, though it is still early days. Interestingly, the fit with both models is “okay” but they provide different and incompatible projections for the next week. It is not clear which model is/will …
Sydney COVID-19 projections – 15 September 2021
What’s new? Today’s announcement was 1259 new local cases in NSW is highly consistent with the observation that we have crossed the peak number of new cases. A peak in September was suggested by the Richards’ growth model for close to three weeks, though this was uncertain. At this point, it is implausible that we …
Victoria COVID-19 projections – 15 September 2021
What’s new? Today’s announcement was 423 new local cases in Victoria is mostly compatible with both the Gompertz and Richards’ growth curve models, though it is still early days. It is likely that both models are underestimating, but improving, especially the Richards’ growth curve model. Both models have problems with the Richards’ curve increasingly uncertain …
Sydney COVID-19 projections – 14 September 2021
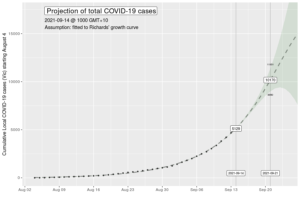
What’s new? Today’s announcement was 1127 new local cases in NSW is highly consistent with the observation that we have crossed the peak number of new cases. A peak in September was suggested by the Richards’ growth model for close to three weeks, though this was uncertain. At this point, it is implausible that we …
Victoria COVID-19 projections – 14 September 2021
What’s new? Today’s announcement was 445 new local cases in Victoria is mostly compatible with both the Gompertz and Richards’ growth curve models, though it is still early days. It is likely that both models are underestimating, but improving, especially the Richards’ growth curve model. The projections of the cumulative number of cases for today …
Sydney COVID-19 projections – 13 September 2021
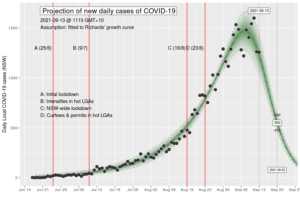
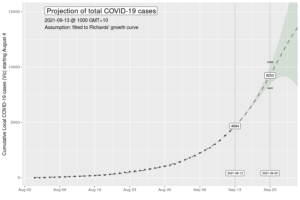
What’s new? Today’s announcement was 1257 new local cases in NSW is highly consistent with the observation that we are at, or have crossed, the peak number of new cases. Despite the uncertainty inherent in the model, that a peak was arriving has been suggested by the Richards’ growth curve model for over a fortnight. …
Victoria COVID-19 projections – 13 September 2021
What’s new? Today’s announcement was 473 new local cases in Victoria is mostly compatible with both the Gompertz and Richards’ growth curve models, though it is early days. It is likely that both models are underestimating, especially the Gompertz model. The projections of the cumulative number of cases for today from 7 days ago underestimated …
Sydney COVID-19 projections – 12 September 2021
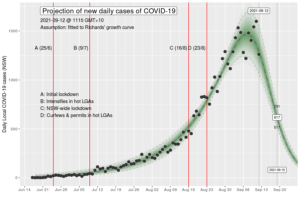
What’s new? Today’s announcement was 1262 new local cases in NSW is consistent with the observation that we are approaching or have reached the peak number of new cases. Despite the uncertainty inherent in the model, that a peak was arriving has been suggested by the Richards’ growth curve model for over a fortnight. Although …
Victoria COVID-19 projections – 12 September 2021
What’s new? Today’s announcement was 392 new local cases in Victoria is mostly compatible with both the Gompertz and Richards’ growth curve models, though it is early days. It is likely that both models are underestimating, especially the Gompertz model. The projections of the cumulative number of cases for today from 7 days ago underestimated …
Sydney COVID-19 projections – 11 September 2021
What’s new? Today’s announcement was 1599 new local cases in NSW is consistent with the observation that growth of cases has slowed, and that we may be approaching, or have reached, the peak number of new cases. This is a hopeful sign. The cumulative case projection for today from 7 days ago is overestimating by …
Victoria COVID-19 projections – 11 September 2021
What’s new? Today’s announcement was 450 new local cases in Victoria is notably higher than both the Gompertz and Richards’ growth curve models, though it is early days. It is likely that both models are underestimating, especially the Gompertz model. The projections of the cumulative number of cases for today from 7 days ago underestimated …
Sydney COVID-19 projections – 10 September 2021
What’s new? Today’s announcement was 1542 new local cases in NSW is consistent with the observation that growth of cases has slowed, and that we may be approaching, or have reached, the peak number of new cases. This is a hopeful sign. The cumulative case projection for today from 7 days ago is overestimating by …
Victoria COVID-19 projections – 10 September 2021
What’s new? Today’s announcement was 334 new local cases in Victoria is consistent with both the Gompertz and Richards’ growth curve models, though it is early days. It is not clear which is the better model, though the Richards’ growth curve model is more likely to be correct in the very short term (the model …
Sydney COVID-19 projections – 9 September 2021
What’s new? Today’s announcement was 1405 new local cases in NSW is consistent with the observation that growth of cases has slowed, and that we may been approaching, or have reached, the peak number of new cases. This is a hopeful sign. The cumulative case projection for today from 7 days ago is overestimating by …
Sydney COVID-19 projections – 8 September 2021
What’s new? Today’s announcement was 1480 new local cases in NSW is consistent with the observation that growth of cases has slowed, and that we may been approaching, or have reached, the peak number of new cases. This is a hopeful sign. The cumulative case projection for today from 7 days ago is overestimating by …
Sydney COVID-19 projections – 7 September 2021
What’s new? Today’s announcement was 1220 new local cases in NSW, which is again substantially less than the trend. This is an increasingly hopeful sign. Today’s and yesterday’s case count provides stronger support that the growth in cases is slowing. This has seemingly been the case for several days. The cumulative case projection for today …
Sydney COVID-19 projections – 6 September 2021
What’s new? Today’s announcement was 1281 new local cases in NSW, which is substantially less than the trend. This is a hopeful sign. The model remains largely stable, though today’s case count provides further support that the growth in cases is slowing. This has seemingly been the case for several days. The cumulative case projection …
Sydney COVID-19 projections – 5 September 2021
What’s new? Today’s announcement was 1485 new local cases in NSW. This remains highly consistent with the model estimate. The upwards trajectory of ongoing growth continues, but does seem to be slowing. The Richards’ growth curve model has caught up with the recent data. The cumulative case projection for today from 7 days ago, for …
Sydney COVID-19 projections – 4 September 2021
What’s new? Today’s announcement was 1533 new local cases in NSW, another record high. This is highly consistent with the model estimate. The upwards trajectory of ongoing growth continues. The Richards’ growth curve model has caught up with the recent data. The cumulative case projection for today from 7 days ago is within 1% of …
Sydney COVID-19 projections – 3 September 2021
What’s new? Today’s announcement was 1431 new local cases in NSW, another record high. This is highly consistent with the model estimate. The upwards trajectory of ongoing growth continues. The Richards’ growth curve model has caught up with the recent data. The cumulative case projection for today from 7 days ago is within 1% of …
Sydney COVID-19 projections – 2 September 2021
What’s new? Today’s announcement was 1288 new local cases in NSW. This is largely consistent with the model estimate. The upwards trajectory of ongoing growth continues. The Richards’ growth curve model has caught up with the recent data. The cumulative case projection for today from 7 days ago underestimated by only 1%. There is a …
Sydney COVID-19 projections – 1 September 2021
What’s new? Today’s announcement was 1116 new local cases in NSW. This is consistent with the model estimate. The upwards trajectory of ongoing growth continues. The Richards’ growth curve model has caught up with the recent data. The cumulative case projection for today from 7 days ago underestimated by only 1%. Of some concern, it …
Sydney COVID-19 projections – 31 August 2021
What’s new? Today’s announcement was 1164 new local cases in NSW. This is consistent with the model estimate. The upwards trajectory of ongoing growth continues. The Richards’ growth curve model has caught up with the recent data. The cumulative case projection for today from 7 days ago underestimated by only 3%. Of some concern, it …
Sydney COVID-19 projections – 30 August 2021
What’s new? Today’s announcement was another record with 1290 new local cases in NSW. This is consistent with the model estimate. The upwards trajectory of ongoing growth continues. The Richards’ growth curve model seems to have caught up with the recent data. The cumulative case projection for today from 7 days ago underestimated by only …
Sydney COVID-19 projections – 29 August 2021
What’s new? Today’s announcement of a record 1218 new local cases in NSW is consistent with the model estimate. The upwards trajectory of ongoing growth continues. The Richards’ growth curve model seems to have caught up with the recent data. The cumulative case projection for today from 7 days ago underestimated by 5%. The model …
Sydney COVID-19 projections – 28 August 2021
What’s new? Today’s announcement of a record 1035 new local cases in NSW is highly consistent with the model estimate (which was 1042). The upwards trajectory of ongoing growth continues. The Richards’ growth curve model seems to have caught up with the recent data. The cumulative case projection for today from 7 days ago underestimated …
Sydney COVID-19 projections – 27 August 2021
What’s new? Today’s announcement of 882 new local cases in NSW is consistent with the model and the trajectory of ongoing growth continues. Yesterday, we had a record high where there were more than one thousand new cases in a day for the first time in Australia. The Gompertz model has had poor fit with …
Sydney COVID-19 projections – 26 August 2021
What’s new? Today’s announcement of 1029 new local cases in NSW is yet another record high in the outbreak. It is compatible with model and the trajectory of ongoing growth continues. The Gompertz model has had poor fit with the data series so its projections at this time are not plausible. The Richards’ growth curve …
Sydney COVID-19 projections – 25 August 2021
What’s new? Today’s announcement of 919 new local cases in NSW is another record high in the outbreak. Yesterday, I noted a “glimmer of hope” in that there was the potential suggestion that case counts might have flattened. Today’s number of cases unfortunately, are more compatible with the notion that yesteday’s lower count was a …
Sydney COVID-19 projections – 24 August 2021
What’s new? Today’s announcement of 753 new local cases in NSW offers a potential glimmer of hope. It is substantially less than the case counts from the past three days, which were all in the 800s. Moreover, the new case counts of individual local government areas with the highest number of cases in the current …
Sydney COVID-19 projections – 23 August 2021
What’s new? Today’s announcement of 818 new local cases in NSW is consistent with the upwards leap in case number seen over the past few days. Both the Gompertz and the Richards’ growth curve models are underestimating. This is consistent with the interpretation that the current growth dynamics have worsened compared to the trend up …
Sydney COVID-19 projections – 22 August 2021
What’s new? Today’s announcement of 830 new local cases in NSW is the highest of this outbreak, and consistent with the shocking upwards leap in case numbers we saw yesterday. Both the Gompertz and the Richards’ growth curve models are underestimating. This is consistent with the interpretation that the current growth dynamics have worsened compared …
Sydney COVID-19 projections – 21 August 2021
What’s new? Today’s announcement of 825 new local cases in NSW is again another shocking leap upwards in case numbers. Both the Gompertz and the Richards’ growth curve models are underestimating. An interpretation of this is that the current growth dynamics, on average, have worsened. This coincides with the major outbreak in Western Sydney. The …
Sydney COVID-19 projections – 20 August 2021
What’s new? Today’s announcement of 644 new local cases in NSW is the third day of substantially higher than the model estimates. Both the Gompertz and the Richards’ growth curve models are underestimating. An interpretation of this is that the current growth dynamics, on average, have worsened. This coincides with the major outbreak in Western …
Sydney COVID-19 projections – 19 August 2021
What’s new? Today’s announcement of 681 new local cases in NSW is even higher than yesterday’s escalation in case numbers. It is substantially higher than the model estimate. It is likely that both the Gompertz and the Richards’ growth curve models are underestimating. In interpretation of this is that the current growth dynamics, on average, …
Sydney COVID-19 projections – 18 August 2021
What’s new? Today’s announcement of 633 new local cases in NSW was a shocking jump in case numbers. It is substantially higher than the model estimate. The Gompertz model remains somewhat stable, though the Richards’ growth curve model has had difficulty fitting the data. Both the models are performing okay though are biased towards underestimating. …
Sydney COVID-19 projections – 17 August 2021
What’s new? Today’s announcement of 452 new local cases in NSW is mostly compatible with the model estimate. The model remains largely stable. Both the models are performing okay though are likely to be biased towards underestimating. The projections for the cumulative number of local cases for today, from the Gompertz and Richards’ growth models …
Sydney COVID-19 projections – 16 August 2021
What’s new? Today’s announcement of 478 new local cases in NSW is mostly compatible with the model estimate. The model remains largely stable. Both the models are performing okay though are likely to be biased towards underestimating. The projections for the cumulative number of local cases for today, from the Gompertz and Richards’ growth models …
Sydney COVID-19 projections – 15 August 2021
What’s new? Today’s announcement of 415 new local cases in NSW is compatible with the model estimate. The model remains largely stable. Both the models are performing okay though are likely to be biased towards underestimating. The projections for the cumulative number of local cases for today, from the Gompertz and Richards’ growth models 7 …
Sydney COVID-19 projections – 14 August 2021
What’s new? Today’s announcement of 466 new local cases in NSW is again the highest of this outbreak for the second day in a row. It was the first time the case count was over 400. It is rather higher than the model estimate. The model remains largely stable. Both the models are performing okay …
Sydney COVID-19 projections – 13 August 2021
What’s new? Today’s announcement of 390 new local cases in NSW is again the highest of this outbreak. It is higher than the model estimate, though the recent case counts have been bouncing around somewhat. The model remains largely stable. Both the models are performing okay though are likely to be mildly underestimating. The projections …
Sydney COVID-19 projections – 12 August 2021
What’s new? Today’s announcement of 345 new local cases in NSW is mostly consistent with the model estimate. The recent case counts have been bouncing around somewhat, but the model remains largely stable. Both the models are performing okay with acceptable levels of error in its 7-day projected estimates, though biased towards being underestimates. The …
Sydney COVID-19 outbreak projections – 11 August 2021
What’s new? Today’s announcement of 344 new local cases in NSW is higher than the model estimate. The recent case counts have been bouncing around somewhat, but the model remains largely stable. Both the models are performing well with good levels of error in its 7-day projected estimates, though biased towards being underestimates. The projections …
Sydney COVID-19 outbreak projections – 10 August 2021
What’s new? Today’s announcement of 356 new local cases in NSW was the highest so far in this outbreak. The recent case counts have been bouncing around somewhat, but the model remains largely stable. Both the models are performing well with good levels of error in its 7-day projected estimates. The projections for the cumulative …
Sydney COVID-19 outbreak projections – 9 August 2021
What’s new? Today’s announcement of 283 new local cases in NSW is highly consistent with the model estimates and the model remains stable. Both the models are performing well with good levels of error in its 7-day projected estimates. The projections for the cumulative number of local cases for today, from the Gompertz and Richards’ …
Sydney COVID-19 outbreak projections – 8 August 2021
What’s new? Today’s announcement of 262 new local cases in NSW is a relatively (!) relief. It makes it less likely that the higher than expected case counts on the two previous days are an indication of a new adverse change in the direction of the outbreak. The model remains mostly stable. Both the Gompertz …
Sydney COVID-19 outbreak projections – 7 August 2021
What’s new? Today’s announcement of 319 new local cases in NSW is the again, the highest daily count in this outbreak for a second day in a row. For both days, the new daily case count is more than the projected estimate from the model. The Gompertz model continues to be performing well with relatively …
Sydney COVID-19 outbreak projections – 6 August 2021
What’s new? Today’s announcement of 291 new local cases in NSW is the highest daily count in this outbreak. It is more than the projected estimate from the model, but not overly inconsistent. One data point isn’t a trend. The Gompertz model continues to be performing well with relatively good levels of error in its …
Sydney COVID-19 outbreak projections – 5 August 2021
What’s new? Today’s announcement of 262 local cases in NSW is remains consistent with the model. The Gompertz model continues to be performing well with relatively good levels of error in its 7- and 14-day projected estimates (from a week, and a fortnight ago), with some evidence that it seems to be slightly underestimating. The …
Sydney COVID-19 outbreak projections – 4 August 2021
What’s new? Today’s announcement of 233 local cases in NSW is highly consistent with the model. The Gompertz model updated yesterday gave a projected estimate of an almost exact 232 new cases for today. The Gompertz model seems to be performing well with relatively good levels of error in its 7- and 14-day projected estimates …
Sydney COVID-19 outbreak projections – 3 August 2021
What’s new? Today’s announcement of 199 local cases in NSW continues to be consistent with the models. The Gompertz model seems to be performing well with relatively good levels of error in its 7- and 14-day projected estimates (from a week, and a fortnight ago). There is some evidence that it might be slightly underestimating. …
Sydney COVID-19 outbreak projections – 2 August 2021
What’s new? There are no changes to the interpretation of the model. Today’s announcement of 207 local cases in NSW continues to be consistent with the models. The Gompertz model seems to be performing well with relatively good levels of error in its 7- and 14-day projected estimates (from a week, and a fortnight ago). …
Sydney COVID-19 outbreak projections – 1 August 2021
What’s new? Today’s announcement of 239 local cases in NSW continues to be largely consistent with the models from the past few days. The Gompertz model seems to be performing well with relatively good levels of error in its 7- and 14-day projected estimates (from a week, and a fortnight ago). There is some evidence …
Sydney COVID-19 outbreak projections – 31 July 2021
What’s new? The last couple of weeks has seen a worsening of the Sydney outbreak. Today’s announcement of 210 local cases in NSW is exactly double that thirteen days ago (on 18 July 2021), when I made the last public update. The models, especially the Richards’ growth model has had poor fit with the data, …
Sydney COVID-19 outbreak projections – 18 July 2021
What’s new? Today’s annoucement of 105 local cases (in the 24 hours up to 8 PM yesterday) is consistent with the trend and model, in the context that the model’s fit to the data hasn’t been terribly good. The interpretation from today’s charts is mostly unchanged from yesterday’s. Case counts have bounced up and down …
Sydney COVID-19 outbreak projections – 17 July 2021
What’s new? We are a full one month into the outbreak, with the first cases of community tranmission announced on 17 June 2021. Today annoucement of 111 local cases (in the 24 hours up to 8 PM yesterday) is highly consistent with the trend and model, in the context that the model’s fit to the …
Sydney COVID-19 outbreak projections – 16 July 2021
What’s new? Today annoucement of 97 local cases (in the 24 hours up to 8 PM yesterday) is mostly consistent with the trend and model. Yesterday’s lower than expected case count was likely just the counts bouncing up and down. As noted yesterday, we need to be very cautious then making projections from the model …
Sydney COVID-19 outbreak projections – 15 July 2021
What’s new? Today annoucement of 65 local cases (in the 24 hours up to 8 PM yesterday) is less than expected from the recent trend. This is somewhat inconsistent with the model, which hasn’t had a very good fit to the data, to be perfectly frank. Fewer than expected cases is of course, very much …
Sydney COVID-19 outbreak projections – 14 July 2021
What’s new? The last few days has seen a rapid rise in case numbers, particularly in South Western Sydney, especially in the Fairfield Local Government Area. These new cases appear to be part of an outbreak not evident 1-2 weeks earlier. Today annoucement of 97 local cases (in the 24 hours up to 8 PM …
Sydney COVID-19 outbreak projections – 13 July 2021
What’s new? The last three days has seen a rapid rise in case numbers, particularly in South Western Sydney, especially in the Fairfield Local Government Area. These new cases appear to be part of an outbreak not evident 1-2 weeks earlier. It is important to note that it is very likely that the current model …
Sydney COVID-19 outbreak projections – 12 July 2021
I started these analysis in early July with the new COVID-19 (delta variant) oubreak in Sydney NSW. The purpose of these charts is that they provide some projections into the near future. Hopefully this allows for some data driven expectations. The Sydney 2021 series starts on 12 July 2021 and are available here: https://vitualis.com/?page_id=4071 What’s …
COVID-19 projections – 28 September 2020
I restarted the analyses in early July 2020 with the onset of the new Melbourne outbreak. The logic behind these charts is that they fill an information gap. Official data sources only give historic data series, and mainstream media typically only give near term predictions based on opinion. This will be the final page in this …
COVID-19 projections – 21 September 2020
I restarted the analyses in early July 2020 with the onset of the new Melbourne outbreak. The logic behind these charts is that they fill an information gap. Official data sources only give historic data series, and mainstream media typically only give near term predictions based on opinion. Chart update 21 September 2020 What’s new? …
COVID-19 projections – 14 September 2020
I restarted the analyses in early July 2020 with the onset of the new Melbourne outbreak. The logic behind these charts is that they fill an information gap. Official data sources only give historic data series, and mainstream media typically only give near term predictions based on opinion. Chart update 14 September 2020 What’s new? …
COVID-19 projections – 4 September 2020
I restarted the analyses in early July 2020 with the onset of the new Melbourne outbreak. The logic behind these charts is that they fill an information gap. Official data sources only give historic data series, and mainstream media typically only give near term predictions based on opinion. Chart update 4 September 2020 What’s new? …
COVID-19 projections – 28 August 2020
I restarted the analyses in early July 2020 with the onset of the new Melbourne outbreak. The logic behind these charts is that they fill an information gap. Official data sources only give historic data series, and mainstream media typically only give near term predictions based on opinion. Chart update 28 August 2020 What’s new? …
COVID-19 projections – 27 August 2020
I restarted the analyses in early July 2020 with the onset of the new Melbourne outbreak. The logic behind these charts is that they fill an information gap. Official data sources only give historic data series, and mainstream media typically only give near term predictions based on opinion. Chart update 27 August 2020 What’s new? …
COVID-19 projections – 26 August 2020
I restarted the analyses in early July 2020 with the onset of the new Melbourne outbreak. The logic behind these charts is that they fill an information gap. Official data sources only give historic data series, and mainstream media typically only give near term predictions based on opinion. Chart update 26 August 2020 What’s new? …
COVID-19 projections – 25 August 2020
I restarted the analyses in early July 2020 with the onset of the new Melbourne outbreak. The logic behind these charts is that they fill an information gap. Official data sources only give historic data series, and mainstream media typically only give near term predictions based on opinion. Chart update 25 August 2020 What’s new? …
COVID-19 projections – 24 August 2020
I restarted the analyses in early July 2020 with the onset of the new Melbourne outbreak. The logic behind these charts is that they fill an information gap. Official data sources only give historic data series, and mainstream media typically only give near term predictions based on opinion. Chart update 24 August 2020 What’s new? …
COVID-19 projections – 23 August 2020
I restarted the analyses in early July 2020 with the onset of the new Melbourne outbreak. The logic behind these charts is that they fill an information gap. Official data sources only give historic data series, and mainstream media typically only give near term predictions based on opinion. Chart update 23 August 2020 What’s new? …
COVID-19 projections – 22 August 2020
I restarted the analyses in early July 2020 with the onset of the new Melbourne outbreak. The logic behind these charts is that they fill an information gap. Official data sources only give historic data series, and mainstream media typically only give near term predictions based on opinion. Chart update 22 August 2020 What’s new? …
COVID-19 projections – 21 August 2020
I restarted the analyses in early July with the onset of the new Melbourne outbreak in July 2020. The logic behind these charts is that they fill an information gap. Official data sources only give historic data series, and mainstream media typically only give near term predictions based on opinion. Chart update 21 August 2020 …
COVID-19 projections – 20 August 2020
I restarted the analyses in early July with the onset of the new Melbourne outbreak in July 2020. The logic behind these charts is that they fill an information gap. Official data sources only give historic data series, and mainstream media typically only give near term predictions based on opinion. Chart update 20 August 2020 …
COVID-19 projections – 18 August 2020
I restarted the analyses in early July with the onset of the new Melbourne outbreak in July 2020. The logic behind these charts is that they fill an information gap. Official data sources only give historic data series, and mainstream media typically only give near term predictions based on opinion. Chart update 18 August 2020 …
COVID-19 projections – 17 August 2020
I restarted the analyses in early July with the onset of the new Melbourne outbreak in July 2020. The logic behind these charts is that they fill an information gap. Official data sources only give historic data series, and mainstream media typically only give near term predictions based on opinion. Chart update 17 August 2020 …
COVID-19 projections – 16 August 2020
I restarted the analyses in early July with the onset of the new Melbourne outbreak in July 2020. The logic behind these charts is that they fill an information gap. Official data sources only give historic data series, and mainstream media typically only give near term predictions based on opinion. Chart update 16 August 2020 …
COVID-19 projections – 15 August 2020
I restarted the analyses in early July with the onset of the new Melbourne outbreak in July 2020. The logic behind these charts is that they fill an information gap. Official data sources only give historic data series, and mainstream media typically only give near term predictions based on opinion. Chart update 15 August 2020 …
COVID-19 projections – 14 August 2020
I restarted the analyses in early July with the onset of the new Melbourne outbreak in July 2020. The logic behind these charts is that they fill an information gap. Official data sources only give historic data series, and mainstream media typically only give near term predictions based on opinion. Chart update 14 August 2020 …
COVID-19 projections – 13 August 2020
I restarted the analyses in early July with the onset of the new Melbourne outbreak in July 2020. The logic behind these charts is that they fill an information gap. Official data sources only give historic data series, and mainstream media typically only give near term predictions based on opinion. Chart update 13 August 2020 …
COVID-19 projections – 12 August 2020
I restarted the analyses in early July with the onset of the new Melbourne outbreak in July 2020. The logic behind these charts is that they fill an information gap. Official data sources only give historic data series, and mainstream media typically only give near term predictions based on opinion. Chart update 12 August 2020 …
COVID-19 projections – 11 August 2020
I restarted the analyses in early July with the onset of the new Melbourne outbreak in July 2020. The logic behind these charts is that they fill an information gap. Official data sources only give historic data series, and mainstream media typically only give near term predictions based on opinion. Chart update 11 August 2020 …
COVID-19 projections – 10 August 2020
I restarted the analyses over a month ago with the onset of the new Melbourne outbreak in July 2020. The logic behind these charts is that they fill an information gap. Official data sources only give historic data series, and mainstream media typically only give near term predictions based on opinion. Chart update 10 August …
COVID-19 projections – 9 August 2020
I restarted the analyses over a month ago with the onset of the new Melbourne outbreak in July 2020. The logic behind these charts is that they fill an information gap. Official data sources only give historic data series, and mainstream media typically only give near term predictions based on opinion. Chart update 9 August …
COVID-19 projections – 8 August 2020
I restarted the analyses over a month ago with the onset of the new Melbourne outbreak in July 2020. The logic behind these charts is that they fill an information gap. Official data sources only give historic data series, and mainstream media typically only give near term predictions based on opinion. Chart update 8 August …
COVID-19 projections – 7 August 2020
I restarted the analyses almost a month ago with the onset of the new Melbourne outbreak in July 2020. The logic behind these charts is that they fill an information gap. Official data sources only give historic data series, and mainstream media typically only give near term predictions based on opinion. Chart update 7 August …
COVID-19 projections – 6 August 2020
I restarted the analyses almost a month ago with the onset of the new Melbourne outbreak in July 2020. The logic behind these charts is that they fill an information gap. Official data sources only give historic data series, and mainstream media typically only give near term predictions based on opinion. Chart update 6 August …
COVID-19 projections – 5 August 2020
I restarted the analyses almost a month ago with the onset of the new Melbourne outbreak in July 2020. The logic behind these charts is that they fill an information gap. Official data sources only give historic data series, and mainstream media typically only give near term predictions based on opinion. Chart update 5 August …
COVID-19 projections – 4 August 2020
I restarted the analyses almost a month ago with the onset of the new Melbourne outbreak in July 2020. The logic behind these charts is that they fill an information gap. Official data sources only give historic data series, and mainstream media typically only give near term predictions based on opinion. Chart update 4 August …
COVID-19 projections – 3 August 2020
I restarted the analyses from early July 2020 with the onset of the new Melbourne outbreak. The logic behind these charts is that they fill an information gap. Official data sources only give historic data series, and mainstream media typically only give near term predictions based on opinion. Chart update 3 August 2020 What’s new? …
COVID-19 projections – 2 August 2020
I restarted the analyses from early July 2020 with the onset of the new Melbourne outbreak. The logic behind these charts is that they fill an information gap. Official data sources only give historic data series, and mainstream media typically only give near term predictions based on opinion. Chart update 2 August 2020 What’s new? …
COVID-19 projections – 1 August 2020
I restarted the analyses from early July 2020 with the onset of the new Melbourne outbreak. The logic behind these charts is that they fill an information gap. Official data sources only give historic data series, and mainstream media typically only give near term predictions based on opinion. Chart update 1 August 2020 What’s new? …
COVID-19 projections – 31 July 2020
I restarted the analyses from early July 2020 with the onset of the new Melbourne outbreak. The logic behind these charts is that they fill an information gap. Official data sources only give historic data series, and mainstream media typically only give near term predictions based on opinion. Chart update 31 July 2020 What’s new? …
COVID-19 projections – 30 July 2020
I restarted the analyses from early July 2020 with the onset of the new Melbourne outbreak. The logic behind these charts is that they fill an information gap. Official data sources only give historic data series, and mainstream media typically only give near term predictions based on opinion. Chart update 30 July 2020 What’s new? …
COVID-19 projections – 29 July 2020
I restarted the analyses from early July 2020 with the onset of the new Melbourne outbreak. The logic behind these charts is that they fill an information gap. Official data sources only give historic data series, and mainstream media typically only give near term predictions based on opinion. Chart update 29 July 2020 What’s new? …
COVID-19 projections – 28 July 2020
I restarted the analyses from early July 2020 with the onset of the new Melbourne outbreak. The logic behind these charts is that they fill an information gap. Official data sources only give historic data series, and mainstream media typically only give near term predictions based on opinion. Chart update 28 July 2020 What’s new? …
COVID-19 projections – 27 July 2020
I restarted the analyses from early July 2020 with the onset of the new Melbourne outbreak. The logic behind these charts is that they fill an information gap. Official data sources only give historic data series, and mainstream media typically only give near term predictions based on opinion. Chart update 27 July 2020 What’s new? …
COVID-19 projections – 26 July 2020
I restarted the analyses from early July 2020 with the onset of the new Melbourne outbreak. The logic behind these charts is that they fill an information gap. Official data sources only give historic data series, and mainstream media typically only give near term predictions based on opinion. Chart update 26 July 2020 What’s new? …
COVID-19 projections – 25 July 2020
I restarted the analyses from early July 2020 with the onset of the new Melbourne outbreak. The logic behind these charts is that they fill an information gap. Official data sources only give historic data series, and mainstream media typically only give near term predictions based on opinion. Chart update 25 July 2020 What’s new? …
COVID-19 projections – 24 July 2020
I restarted the analyses from early July 2020 with the onset of the new Melbourne outbreak. The logic behind these charts is that they fill an information gap. Official data sources only give historic data series, and mainstream media typically only give near term predictions based on opinion. Chart update 24 July 2020 What’s new? …
COVID-19 projections – 23 July 2020
I restarted the analyses from early July 2020 with the onset of the new Melbourne outbreak. The logic behind these charts is that they fill an information gap. Official data sources only give historic data series, and mainstream media typically only give near term predictions based on opinion. Chart update 23 July 2020 What’s new? …
COVID-19 projections – 22 July 2020
I restarted the analyses from early July 2020 with the onset of the new Melbourne outbreak. The logic behind these charts is that they fill an information gap. Official data sources only give historic data series, and mainstream media typically only give near term predictions based on opinion. Chart update 22 July 2020 What’s new? …
COVID-19 projections – 21 July 2020
I have restarted the analyses since early July 2020 with the new Melbourne outbreak. The logic behind these charts is that they fill an information gap. Official data sources only give historic data series, and mainstream media typically only give near term predictions based on opinion. Chart update 21 July 2020 What’s new? Today’s new …
COVID-19 projections – 20 July 2020
I have restarted the analyses since for about a fortnight with the new Melbourne outbreak. The logic behind these charts is that they fill an information gap. Official data sources only give historic data series, and mainstream media typically only give near term predictions based on opinion. Chart update 20 July 2020 What’s new? Today’s …
COVID-19 projections – 19 July 2020
I have restarted the analyses since for about a fortnight with the new Melbourne outbreak. The logic behind these charts is that they fill an information gap. Official data sources only give historic data series, and mainstream media typically only give near term predictions based on opinion. Chart update 19 July 2020 What’s new? Today’s …
COVID-19 projections – 18 July 2020
I have restarted the analyses since for about a fortnight with the new Melbourne outbreak. The logic behind these charts is that they fill an information gap. Official data sources only give historic data series, and mainstream media typically only give near term predictions based on opinion. Chart update 18 July 2020 What’s new? Today’s …
COVID-19 projections – 17 July 2020
I have restarted the analyses since for about a week with the new Melbourne outbreak. The logic behind these charts is that they fill an information gap. Official data sources only give historic data series, and mainstream media typically only give near term predictions based on opinion. Chart update 17 July 2020 What’s new? Today’s …
COVID-19 projections – 16 July 2020
I have restarted the analyses since for about a week with the new Melbourne outbreak. The logic behind these charts is that they fill an information gap. Official data sources only give historic data series, and mainstream media typically only give near term predictions based on opinion. Chart update 16 July 2020 What’s new? Today’s …
COVID-19 projections – 15 July 2020
I have restarted the analyses since for about a week with the new Melbourne outbreak. The logic behind these charts is that they fill an information gap. Official data sources only give historic data series, and mainstream media typically only give near term predictions based on opinion. Chart update 15 July 2020 What’s new? Today’s …
COVID-19 projections – 14 July 2020
I have restarted the analyses since for about a week with the new Melbourne outbreak. The logic behind these charts is that they fill an information gap. Official data sources only give historic data series, and mainstream media typically only give near term predictions based on opinion. Chart update 14 July 2020 What’s new? Today’s …
COVID-19 projections – 13 July 2020
Hello everyone! Some of you might be aware that I’ve been publishing some short-term case number projections online on Facebook. These were originally a daily series from March to April. I have restarted the analyses since for about a week with the new Melbourne outbreak. The logic behind these charts is that they fill an …

